Navigation
This page contains the following topics:
- Command Center Overview
- If SQL Express, enable TCP/IP
- Create SQL Database
- Install Command Center 💡
- Configure Windows Firewall
- Weak Ciphers
- Welcome Wizard
- Administration Configuration
- Command Center Certificate
- Discover Devices
- Configure Syslog on Devices
- Configure Email Alerting 💡
- Use Command Center
💡 = Recently Updated
Command Center Overview
Command Center can be used to monitor, alert, and report on the following devices:
- NetScaler
- NetScaler VPX
- NetScaler SDX
- NetScaler Gateway Enterprise Edition
- CloudBridge
- CloudBridge VPX
- Citrix Repeater
Command Center is free for all editions of NetScaler so there’s no excuse to not install it.
Citrix whitepaper – Citrix Command Center – Deployment Sizing Guide: database sizing for scalar counters, vector counters, and Syslog.
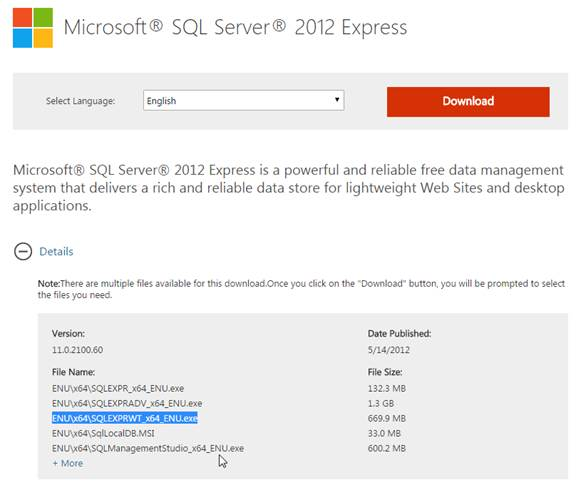
SQL Express
If using SQL Express to store the Command Center database, do the following to enable TCP/IP:
- When downloading SQL Server 2012 Express, either select the option With Tools or download SQL Server Management Studio and install it separately.
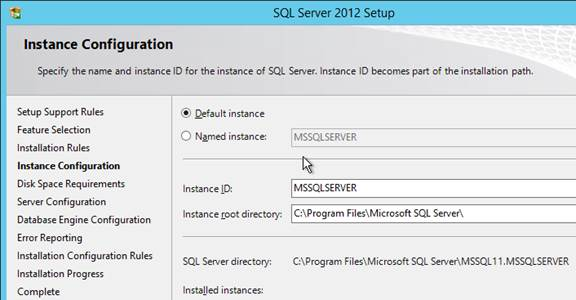
- When installing SQL Express, feel free to use the default instance instead of a named instance.
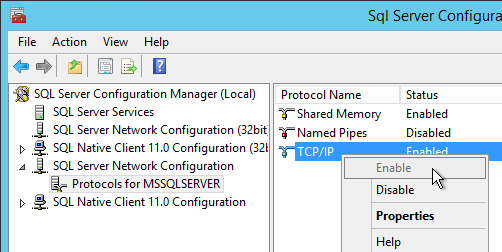
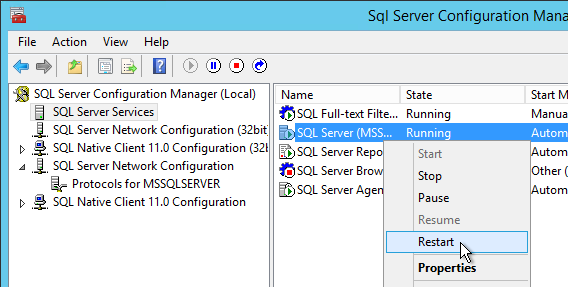
- In SQL Server Configuration Manager, expand SQL Server Network Configuration and click the Protocols node.
- On the right, right-click TCP/IP and enable it. Then double-click TCP/IP.
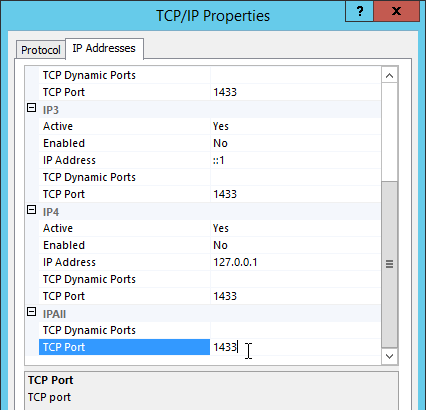
- On the IP Addresses tab, scroll all the way down and in the IPAll section, remove any TCP Dynamic Ports and instead enter a static TCP Port. 1433 is the typical default port.
- On the left, click SQL Server Services.
- On the right, right-click SQL Server and click Restart.
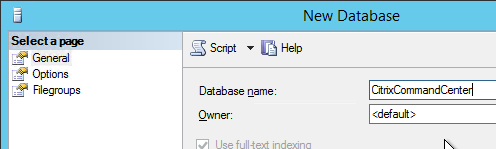
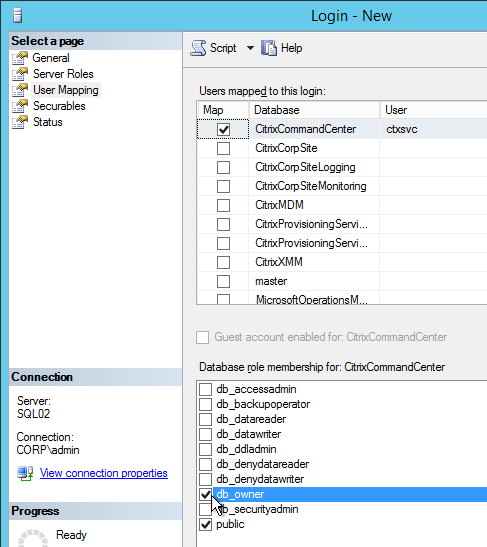
Create SQL Database and SQL Account
SQL 2005, SQL 2008, and SQL 2012 are supported.
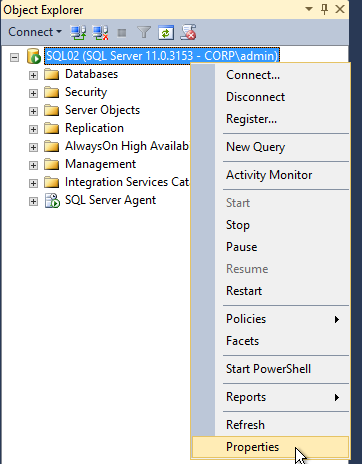
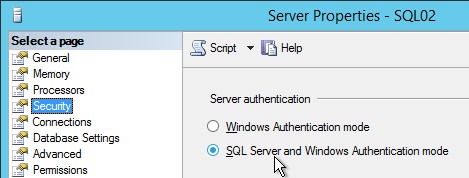
- In SQL Server Management Studio, go to the Properties of the SQL server and ensure that SQL authentication is enabled.
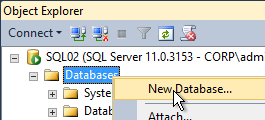
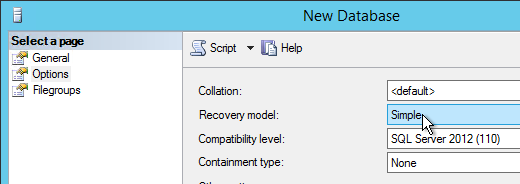
- Create a database and call it CitrixCommandCenter or similar. Configure the Recovery model as desired.
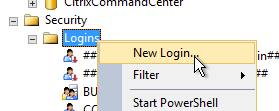
- Create a SQL Login (SQL Server authentication) for Command Center. Set the default database to the Command Center database.
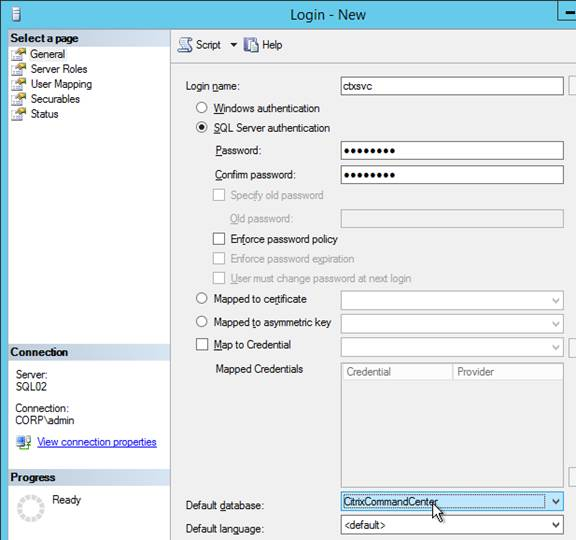
- Add the SQL account to the db_owner database role in the Command Center database.
Install Command Center
- Command Center is supported on Windows Server 2008 R2, and Windows Server 2012 R2.
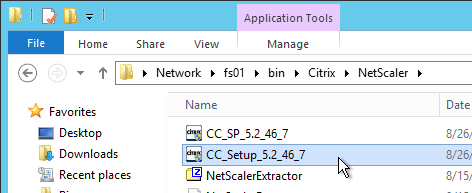
- On the Command Center server, run the downloaded Command Center 5.2.46.7 CC_Setup_5.2_46_7.exe. 💡
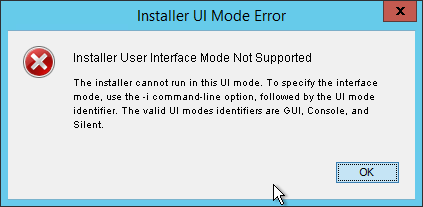
- If the installer refuses to launch without error then you’ll need to uninstall all previously installed Java. Command Center comes with its own Java.
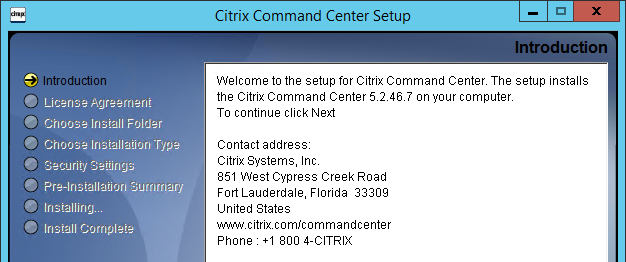
- In the Introduction page, click Next.
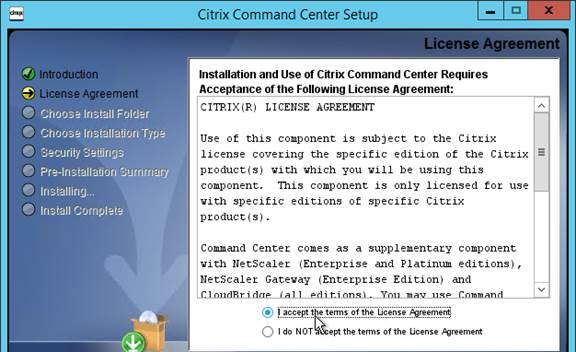
- In the License Agreement page, select I accept the terms and click Next.
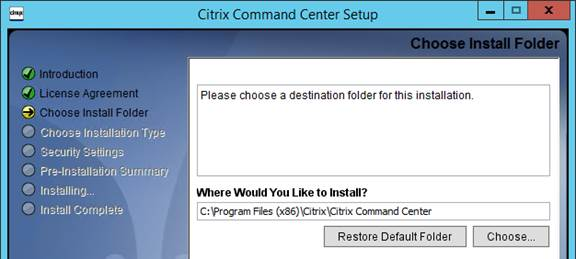
- In the Choose Install Folder page, click Next.
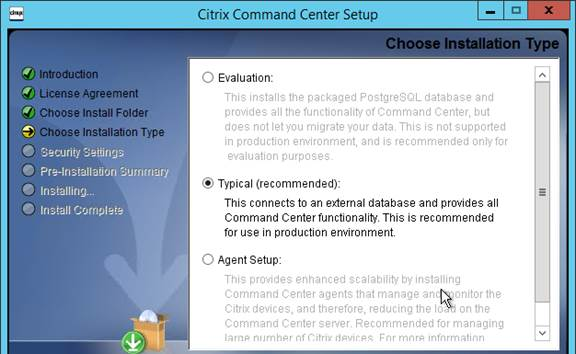
- In the Choose Installation Type page, select Typical and click Next.
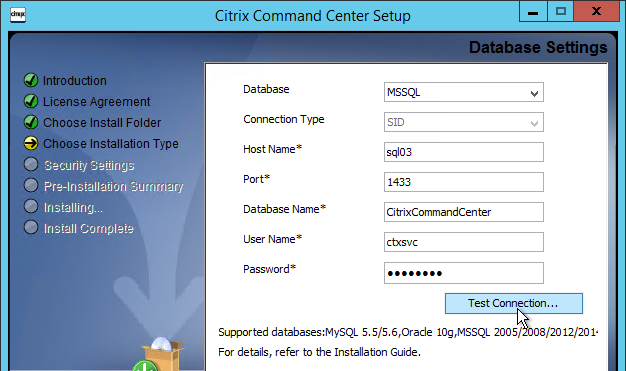
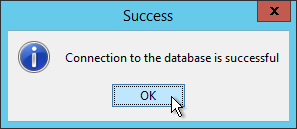
- In the Database Settings page, change the selection to MSSQL and fill in the details. Notice that SQL 2012 and SQL 2014 are now supported. Then click Test Connection.
- Click OK to acknowledge that the connection is successful and then click Next.
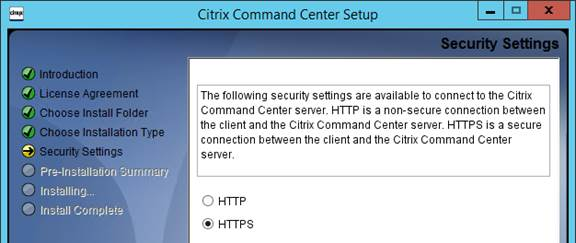
- In the Security Settings page, make your selection and click Next.
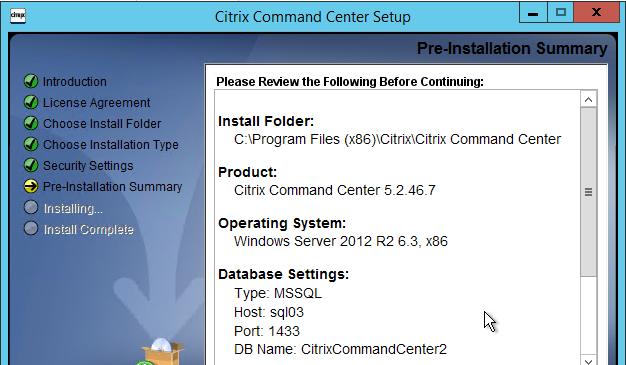
- In the Pre-Installation Summary page, click Install.
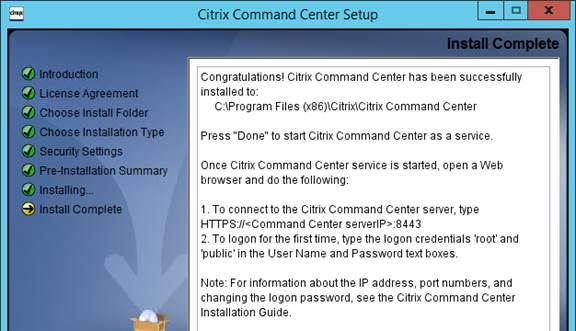
- In the Install Complete page, notice the URL. Click Done.
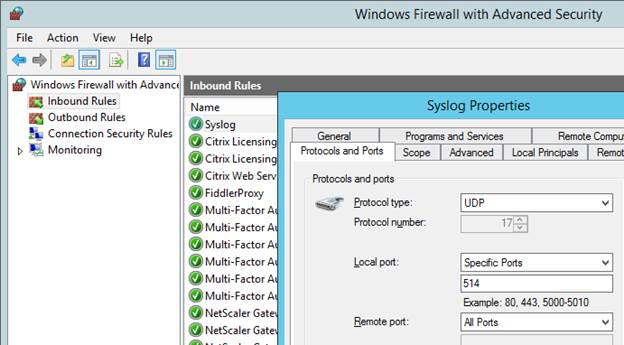
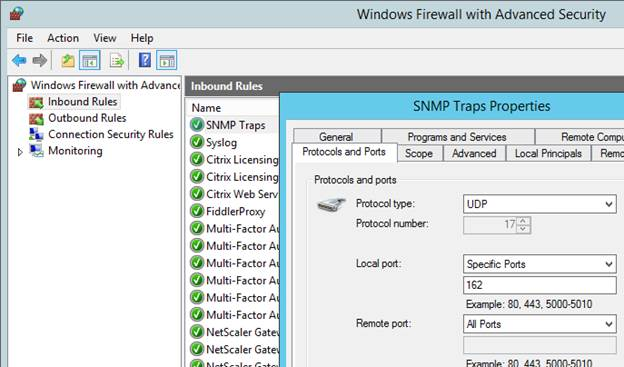
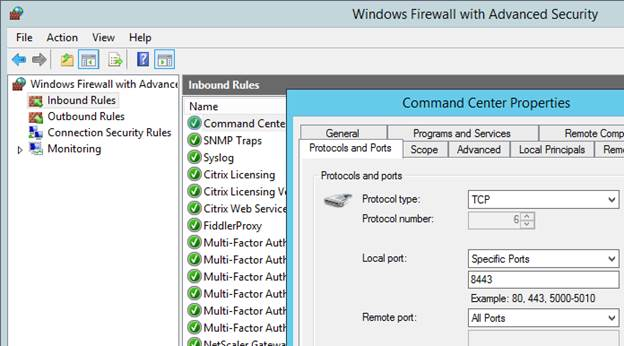
Windows Firewall
Windows Firewall must be configured to allow UDP 162 for SNMP Traps, UDP 514 for SYSLOG, and 8443 for the Command Center management console.
Weak Ciphers
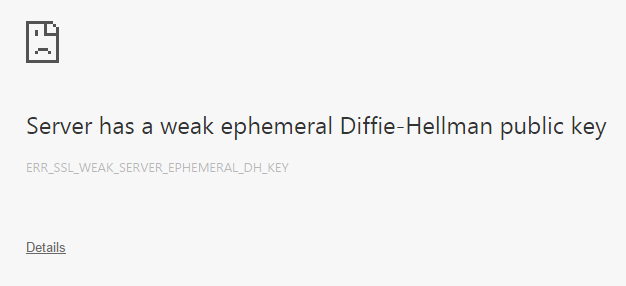
- Point your browser to https://<Server_Name>:8443. If you see a message about weak ephemeral Diffie-Hellman then you’ll need to follow Citrix CTX202036 Error:”ssl_error_weak_server_ephemeral_dh_key” When Launching Citrix Command Center Website.
- Go to C:\Program Files (x86)\Citrix\Citrix Command Center\apache\tomcat\conf\backup and edit the file server.xml. You want the one in the backup folder.
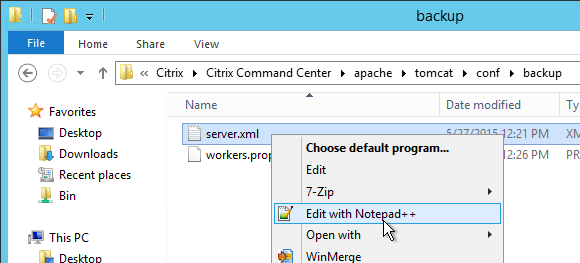
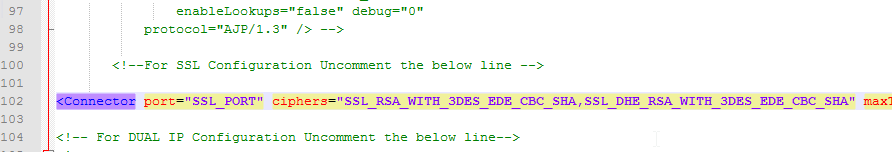
- Near line 102, change the ciphers to the ones listed in the article.
- Go to C:\Program Files (x86)\Citrix\Citrix Command Center\conf and edit the file transportProvider.conf.
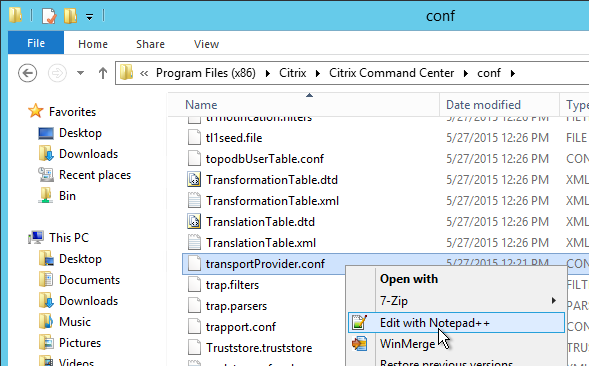
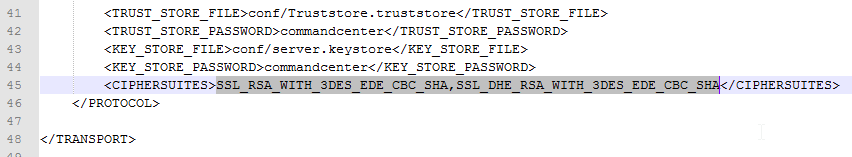
- Near line 45, change the ciphers to the ones listed in the article.
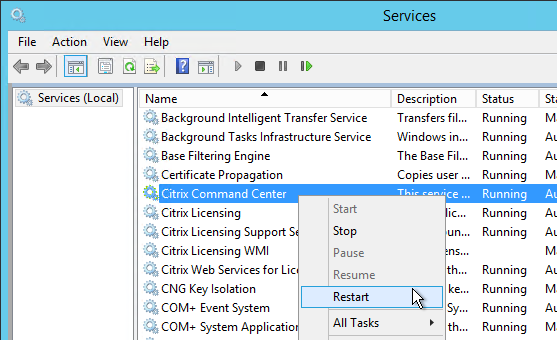
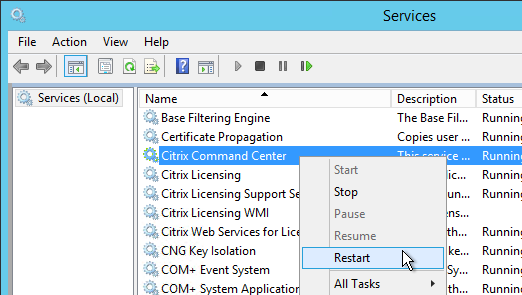
- Go to Services and restart the Citrix Command Center service.
Welcome Wizard
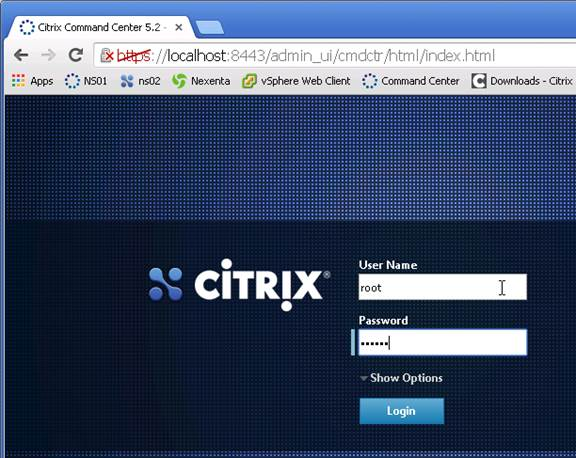
- Go to https://<Server_Name>:8443 and login as root and public.
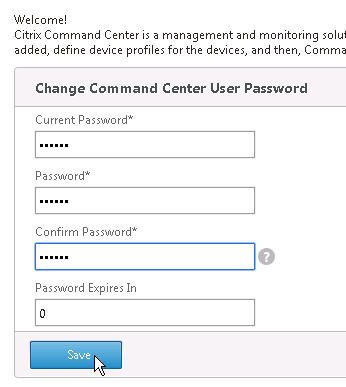
- In the Change Command Center User Password section, enter a new root password and click Save.
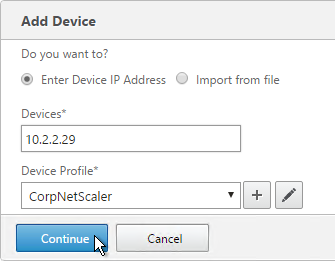
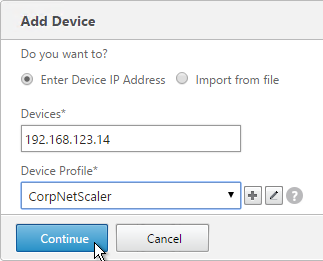
- In the Add Device section, enter the NSIP of a NetScaler device. For a High Availability pair, only enter the NSIP of the primary device.
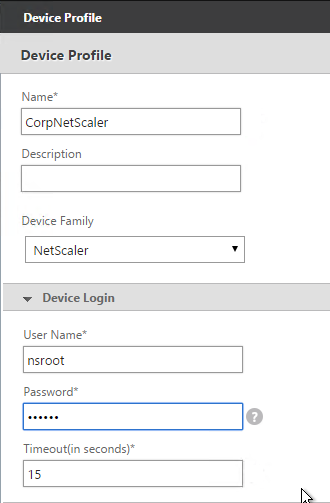
- Click the plus icon next to Device Profile.
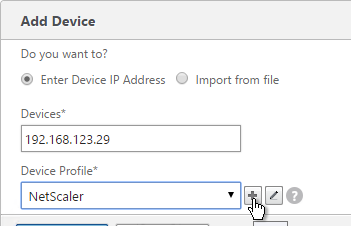
- Give the Device Profile a name. The device profile contains the nsroot password so name the profile something that reflects the team that manages the devices.
- In the Device Login section, enter nsroot as the User Name and the password configured on the NetScaler appliances. Scroll down.
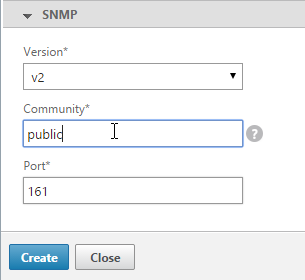
- In the SNMP section, enter a SNMP community name. Command Center will configure this on the appliances. Click Create.
- Back in the Add Device section, click Continue.
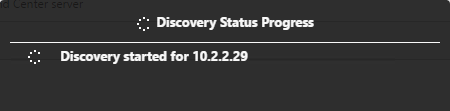
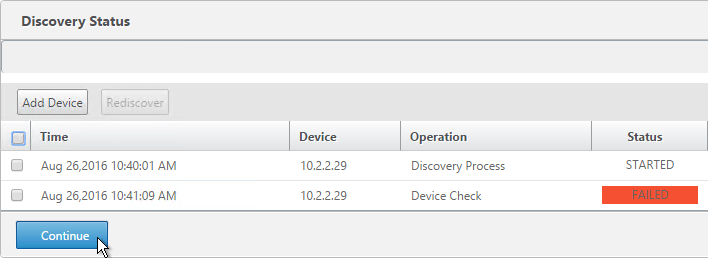
- Command Center will then begin discovery for the device. If Discovery fails, see CTX200377 – Command Center is Unable to Discover NetScaler
- After discovery is complete, click Continue.
- Don’t click Done yet.
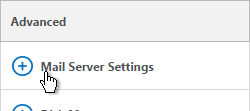
- On the right, in the Advanced column, click Mail Server Settings.
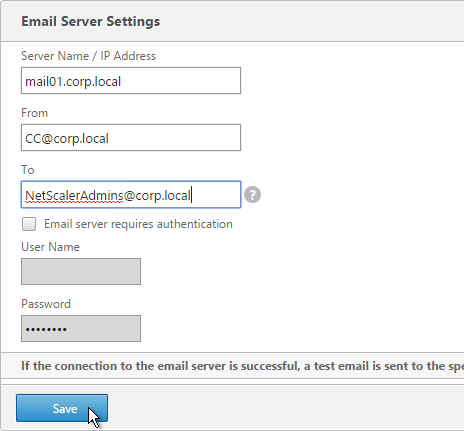
- Enter the mail server information and click Save.
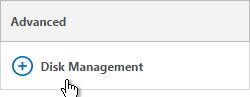
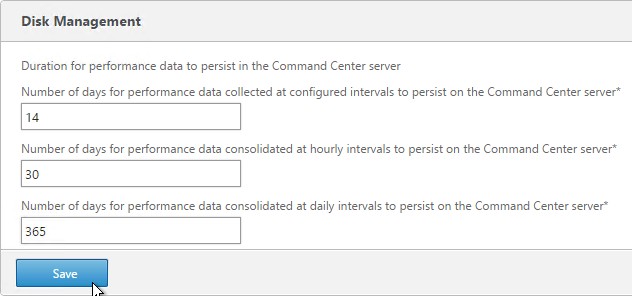
- On the right, in the Advanced column, click Disk Management.
- Adjust the grooming settings as desired and click Save.
- Then click Done.

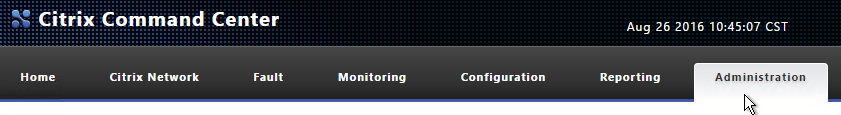
Administration Configuration
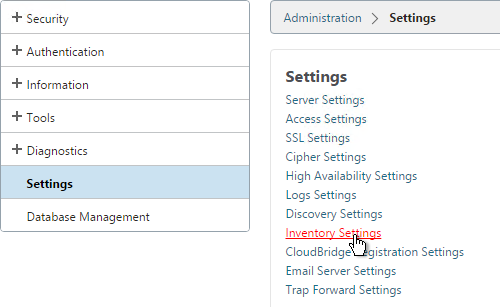
- Switch to the Administration tab.
- Click Settings on the left. On the right, click Inventory Settings.
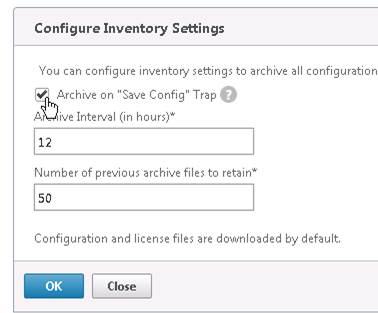
- In the Configure Inventory Settings window, decide if you want to Archive on “Save Config” trap. Click OK when done.
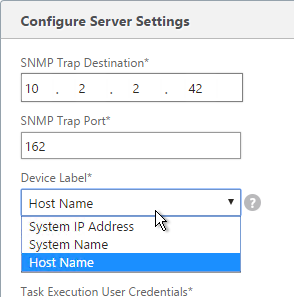
- Click Server Settings.
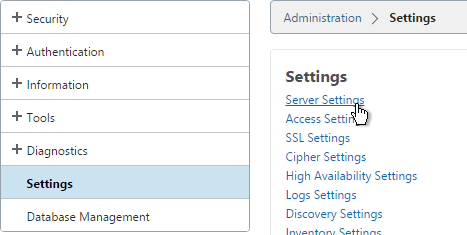
- Command Center defaults to displaying devices based on their IP address. This can be changed to Host Name. Click OK when done.
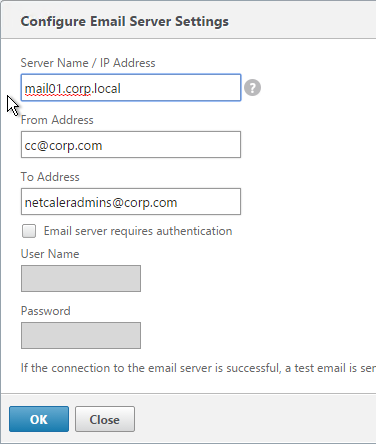
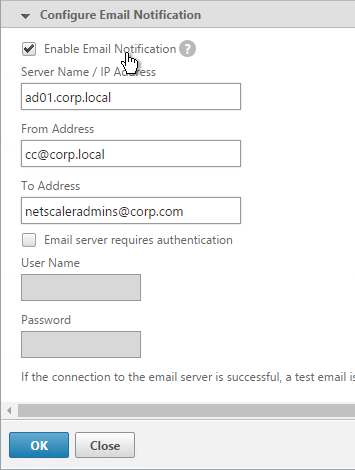
- In the Settings node, click Email Server Settings.
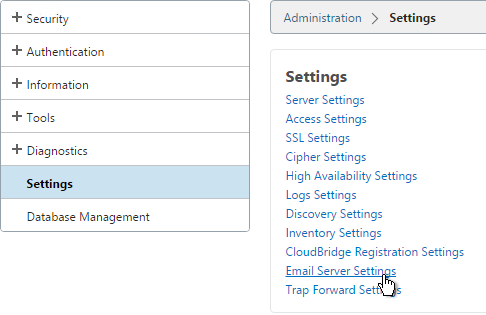
- Fill out the mail server information so you can receive email alerts and click OK.
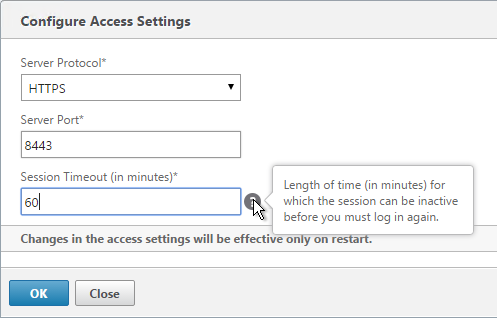
- In the Settings section is Access Settings.
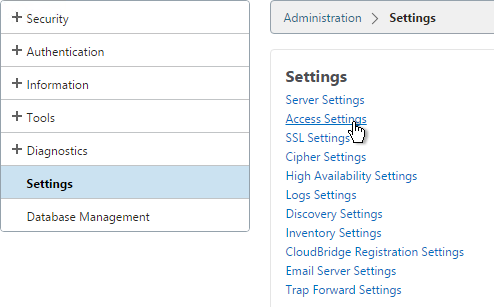
- You can change the Session Timeout.
- On the left, click Database Management. On the right, notice the Purge Settings links. Use those links to control the size of the database.
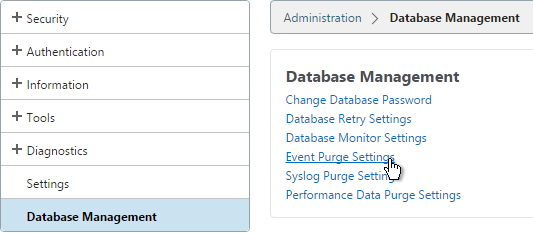
- In the Database Management node, click Database Monitor Settings.
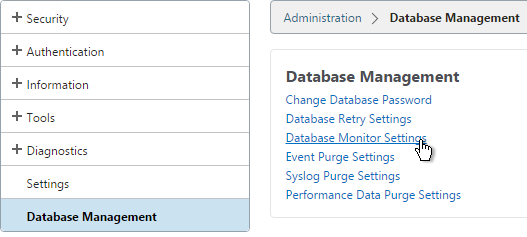
- Specify a database size threshold. If your database automatically grows, then it’s probably best to configure an absolute database size instead of a size percentage.
- When the Threshold is reached, you can configure it to automatically purge data.
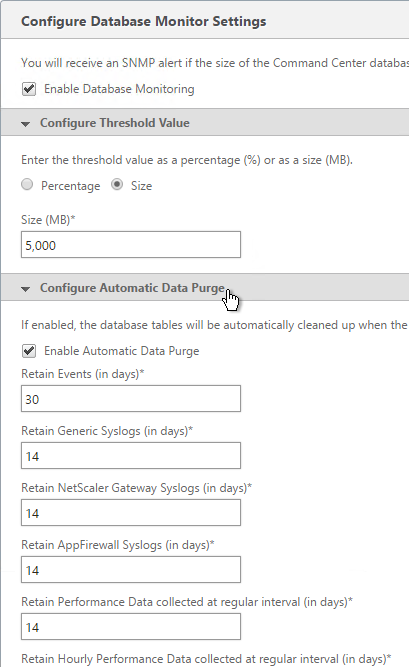
- You can also receive an email notification when the size limit is reached. Click OK when done.
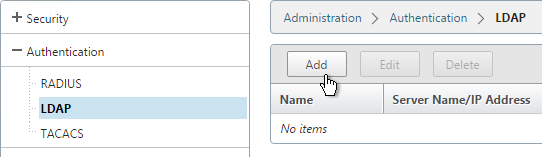
- On the left, expand Authentication and click LDAP.
- On the right, click Add.
- Enter the IP Address of load balanced LDAP (or one Domain Controller).
- Change the Security Type to SSL.
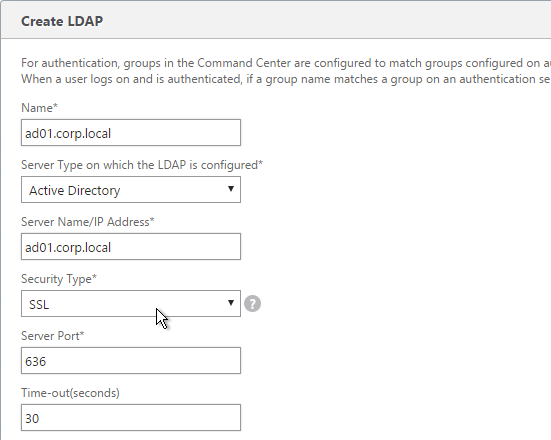
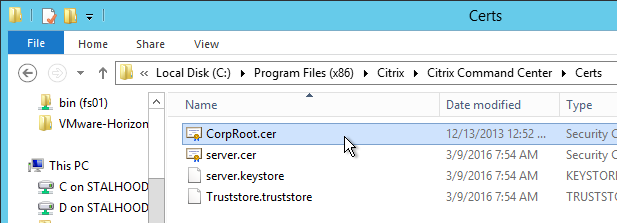
- To support SSL and/or TLS, you need to install the LDAP root certificate on Command Center. Copy the root cert to C:\Program Files (x86)\Citrix\Citrix Command Center\Certs.
- Open an elevated command prompt and cd to C:\Program Files (x86)\Citrix\Citrix Command Center\bin.
- Run importLDAPSCertificate.bat. The first parameter is the name of the root certificate file. The second parameter is commandcenter, which is the password to the trust store.
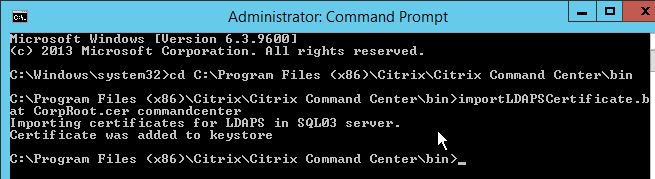
- After importing the root cert, restart the Citrix Command Center service.
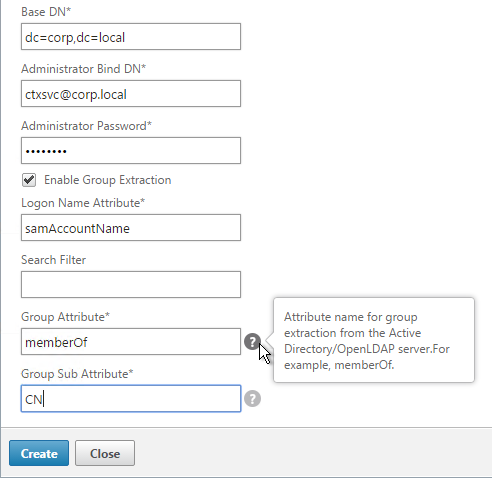
- Back in Command Center adding an LDAP server, enter a Base DN and Bind DN.
- Check the box next to Enable Group Extraction. This will cause more fields to appear.
- Enter the fields shown below. Use the question mark to see examples. Click Create.
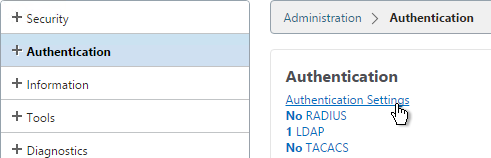
- On the left, click the Authentication node. On the right, click Authentication Settings.
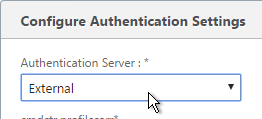
- Change the Authentication Server to External.
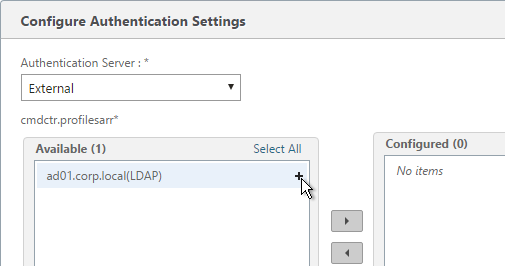
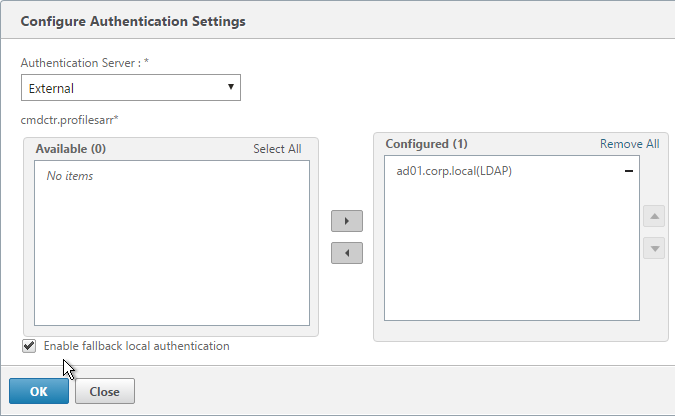
- Move your LDAP server to the right by clicking the plus icon or the right-arrow icon.
- Ensure Enable fallback local authentication is enabled and click OK..
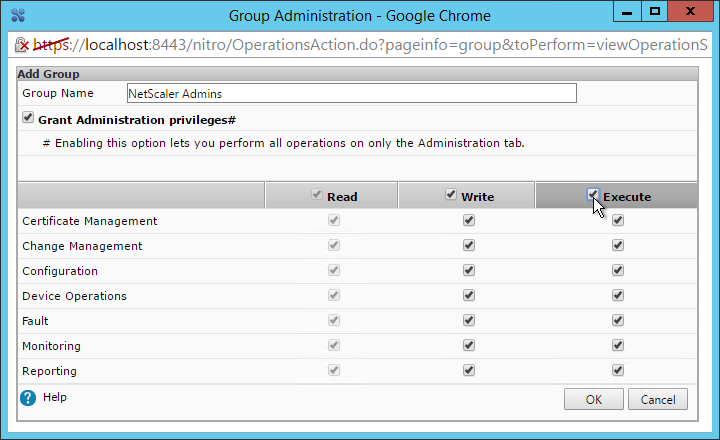
- On the left, expand Security, and click Groups. On the right, click Add.
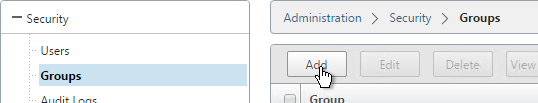
- Type in the case sensitive group name.
- Use the checkboxes to grant your desired permissions and click OK.
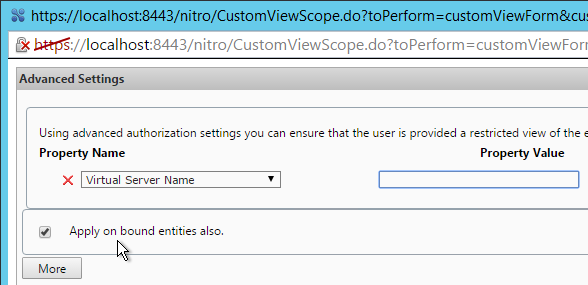
- Once the group is added to Command Center, you can right-click it and click Advanced Settings to restrict the entities that are accessible to the user.
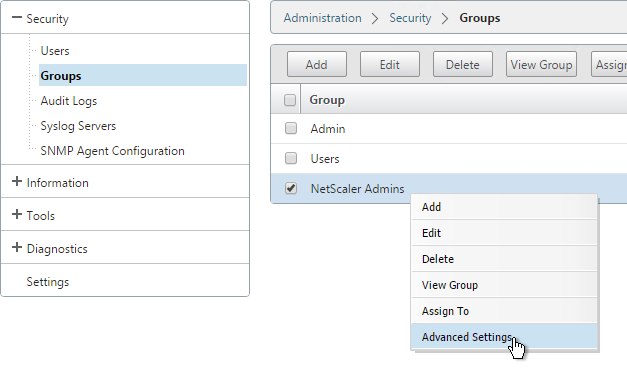
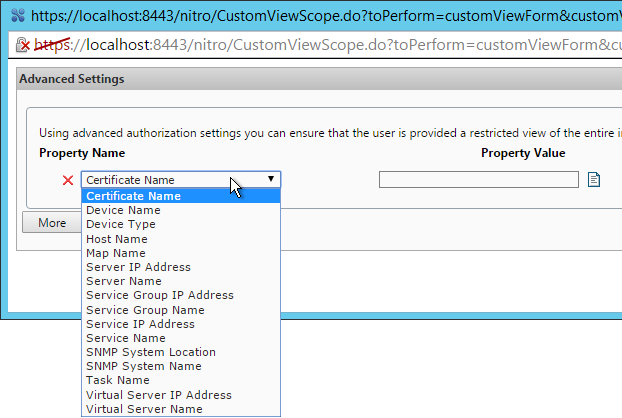
- The Apply on bound entities also checkbox lets the group see the entities that are bound to the restricted object (e.g. services bound to a Virtual Server).
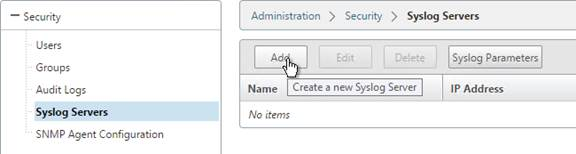
- On the left, expand Security and click Syslog Servers. On the right, click Add.
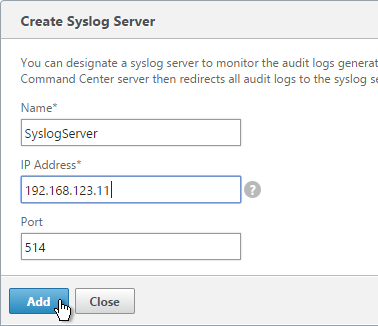
- Enter information for your syslog server and click Add.
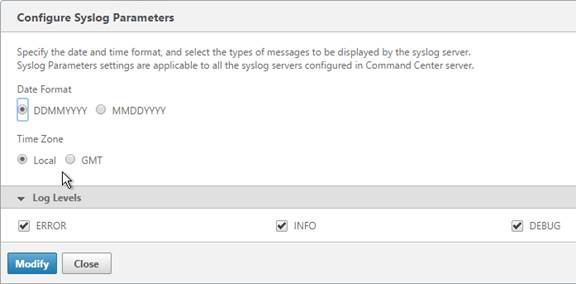
- On the right, click Syslog Parameters.
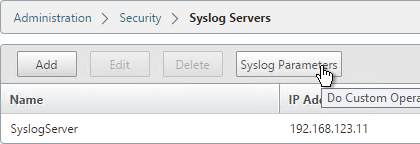
- Set your desired parameters and click Modify.
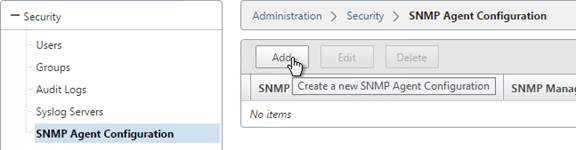
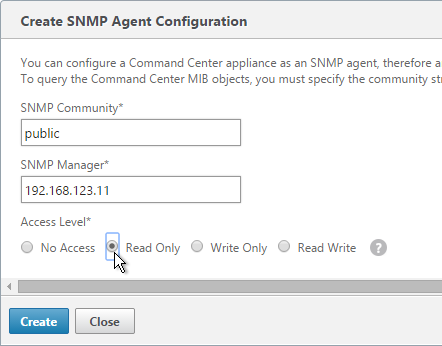
- On the left, under Security, cilck SNMP Agent Configuration. On the right, click Add.
- Enter your SNMP information and click Create.
Command Center Certificate
- Use IIS or the certificates snap-in to create a certificate that matches the FQDN of the Command Center server.
- Export the certificate including private key to a .pfx file.
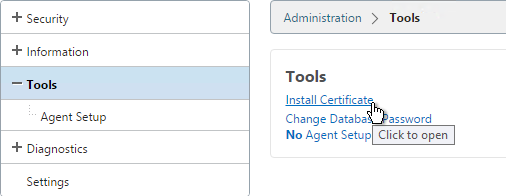
- In the Command Center console, on the Administration tab, click Tools on the left.
- On the right, click Install Certificate.
- Click Choose File to and browse to the PFX file.
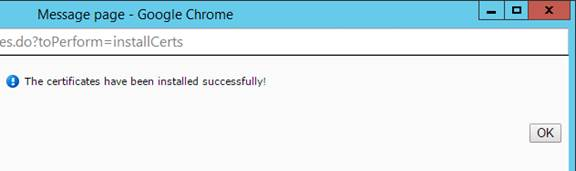
- Enter the PFX password and click OK.
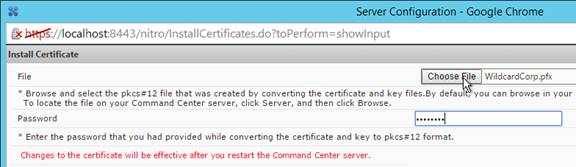
- Click OK
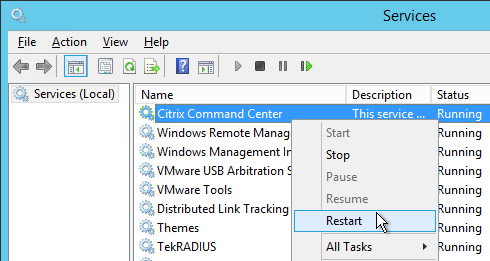
- Restart the Citrix Command Center service.
Discover Devices
Command Center to/from appliance communication:
- Command Center uses SNMP and SSH to communicate with an appliance.
- Appliances use SNMP traps to communicate with Command Center.
- After Command Center discovers an appliance, it will configure the appliance with the correct SNMP settings. You can also configure the SNMP Traps on the appliance manually.
- SFTP is used for file transfer.
- Devices can be configured to send Syslog to Command Center.
The Command Center server supports two types of devices:
- Standalone: A standalone device functions independently and is not configured in an HA setup.
- HA pair: This represents a pair of devices configured in an HA setup. The primary device in an HA setup processes the traffic. The secondary device monitors the primary and takes over the functions of the primary device if that device is unable to continue processing traffic.
You can add devices by specifying the host names of the devices, the IP addresses of each device, a range of IP addresses, and NAT HA devices. You can also add devices by importing the device names from a file. Note that when you specify a range, the first three octets of the low and high addresses must be the same. Command Center can discover only 254 devices in an IP address range.
The Command Center discovery process involves the following steps:
- SNMP ping:The Command Center server sends a Simple Network Management Protocol (SNMP) GET request to a Citrix system-specific object identifier (OID) (for example, 1.3.6.1.4.1.5951.1.1). If the server successfully pings the device, it sets the status of step 2 to SUCCESS and proceeds to step 3. If the GET request fails, the device is not a Citrix device, or it is a Citrix device but SNMP is disabled on it. In either fail case, the Command Center server proceeds to step 2.
- Find Citrix device: The Command Center server attempts to open an SSH session to the device based on the user credentials configured when adding a map. If the SSH session fails, the device is discarded as a non-Citrix device. If the SSH session succeeds, the server issues a CLI command to check whether the device is a Citrix device. A positive result moves the device to the next step. Otherwise, Command Center discards the device as a non-Citrix device. To check the cause of failure of this step, on the Citrix Networktab, click the >>> icon next to the device, and select Status. You can also view the cause of failure on the Device Status page.
- Enable SNMP:On the discovered Citrix device, Command Center executes a command to configure an SNMP community based on the details entered when configuring the map or when adding a device. This step may fail for various reasons, such as network issues or if another SNMP manager is already configured on the device. To check the cause of failure, on the Citrix Network tab, click the >>> icon next to the device, and select Status. You can also view the cause of failure on the Device Status page.
- Add trap destination: Devices communicate with Command Center by sending trap notifications. The Command Center server adds its IP address to the list of trap destinations on the discovered device. This allows Command Center to receive all events/traps generated on the Citrix device. However, this step may fail if the number of trap destinations exceeds the maximum limit of trap destinations on the Citrix device. The limit on Citrix NetScaler devices is 10. If an error occurs you must take corrective measures before you initiate rediscovery of this device. To check the cause of failure, on the Citrix Networktab, click the >>> icon next to the device, and select Status. You can also view the cause of failure on the Device Status page.
- Collect inventory:The Command Center server collects the basic system information for the discovered devices using SNMP. You can view this information on the Device Properties page. For more information, see “Viewing Device Properties” in the Citrix Command Center Online Help. This step may fail if the SNMP manager configured on the Citrix device is not that of the server. It may also fail because of network issues or because the SNMP ports are not configured properly on the firewall. To check the cause of failure, on the Citrix Network tab, click the >>> icon next to the device, and select Status. You can also view the cause of failure on the Device Status page. If an error occurs you must take corrective measures, and then initiate rediscovery of the device.
- Download files: The Command Center server initiates a Secure File Transfer Protocol (SFTP) session based on the user credentials defined while configuring the map. Then, it downloads the configuration and license files of the device. For Repeater devices, it downloads only the configuration files. The Command Center server stores these files in the database. This step may fail because of the following reasons:
- Incorrectly specified user credentials
- Incorrectly configured SFTP ports in the firewall
- Network issues
To check the cause of failure, on the Citrix Network tab, click the >>> icon next to the device, and select Status. You can also view the cause of failure on the Device Status page. If an error occurs, you must take corrective measures, and then initiate rediscovery of this device.
Upon successful discovery, the devices appear on the corresponding maps as icons with their IP addresses or device names. If the server is unable to successfully discover the devices, it marks the devices as inaccessible, generates an event, and groups the devices under the Inaccessible Systems node.
To add more devices to Command Center:
- Click the Citrix Network
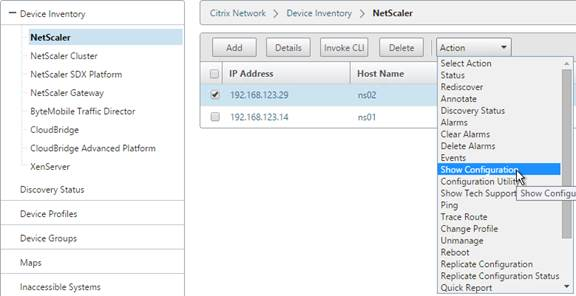
- Under Device Inventory, click NetScaler and on the right click Add.
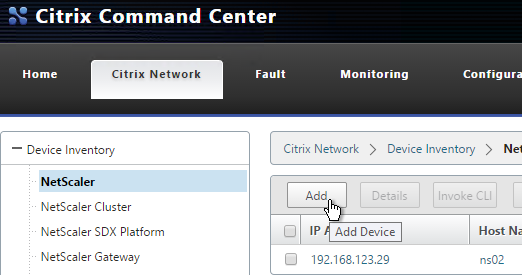
- Enter the NSIP of the NetScalers, select a device profile and click Continue.
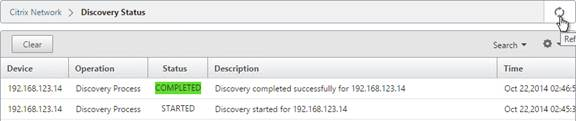
- You can click Discovery Status on the left of the page to check the status of the discovery.
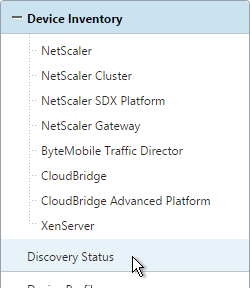
- Click the Refresh button on the top right to update the display. If Discovery fails, see CTX200377 – Command Center is Unable to Discover NetScaler
- Once discovery is complete, you’ll see the devices on the Citrix Network tab in the Device Inventory node. Consult docs.citrix.com (http://docs.citrix.com/en-us/command-center/5-2.html) for more info on what you can do in Command Center.
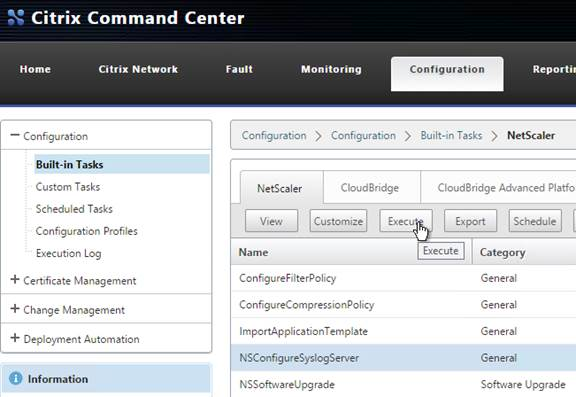
Configure Device Syslog
By default, a discovered device is only configured for SNMP. Additional reporting can be enabled by configuring the devices to send Syslog to Command Center.
- In Command Center, switch to the Configuration
- On the left, under Configuration, click Built-in Tasks.
- On the right, select the NSConfigureSyslogServer task and click Execute.
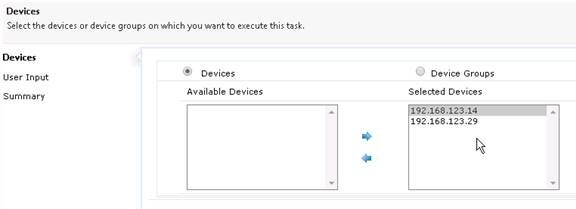
- In the Devices page, move the devices to the right and click Next.
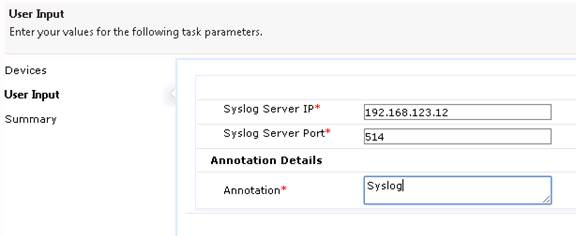
- In the User Input page, enter the IP address of the Command Center server and enter an Annotation. Click Next.
- In the Summary page, click Finish.
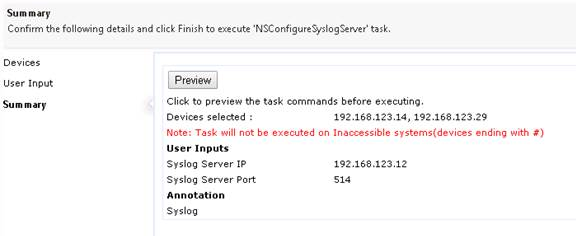
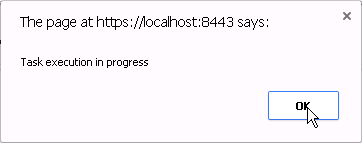
- Click OK to acknowledge that Task execution in progress.
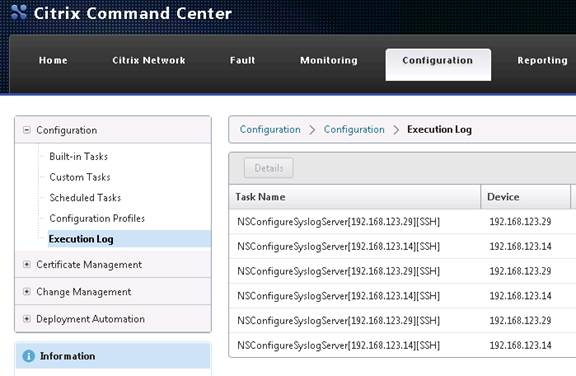
- Review the Execution Log to ensure configuration was completed successfully.
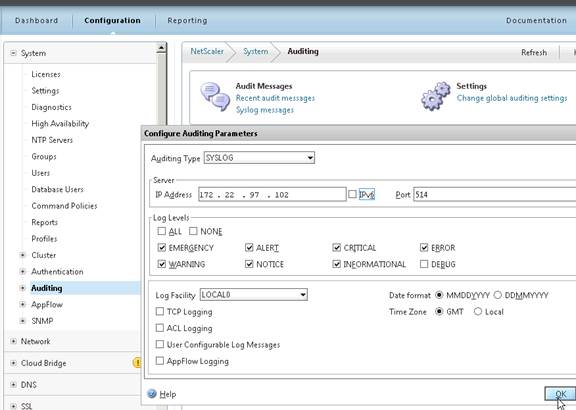
- Or you can configure Syslog directly on the NetScaler appliance. Configure a Syslog action, a Syslog policy, and bind the Syslog policy globally. The Syslog action should point to the Command Center IP address on port UDP 514.
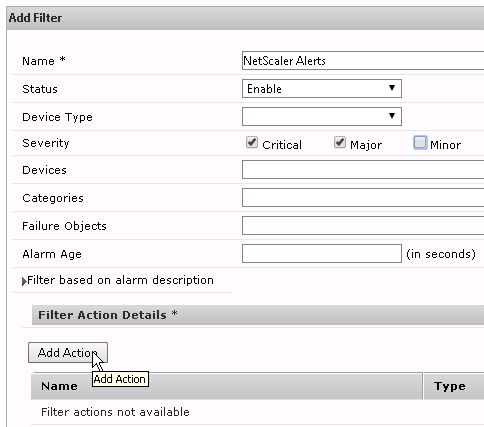
Alerts
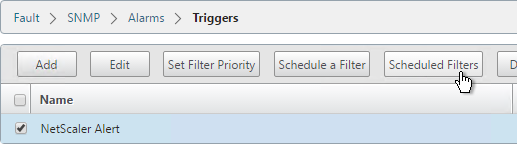
- Switch to the Fault tab.
- On the left, expand SNMP, expand Alarms, and click Triggers. On the right, click Add.
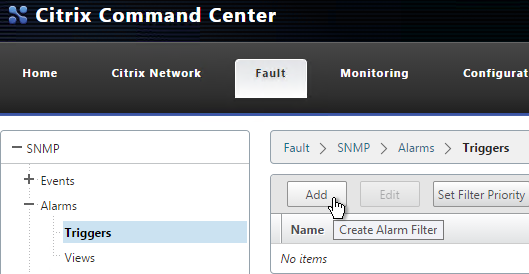
- Give the filter a name. Indicate the alarms for which you wish to receive an email. For example, check the boxes next to Critical and Major. You can restrict the alarms to specific devices.
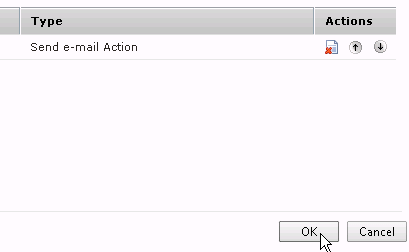
- Click Add Action.
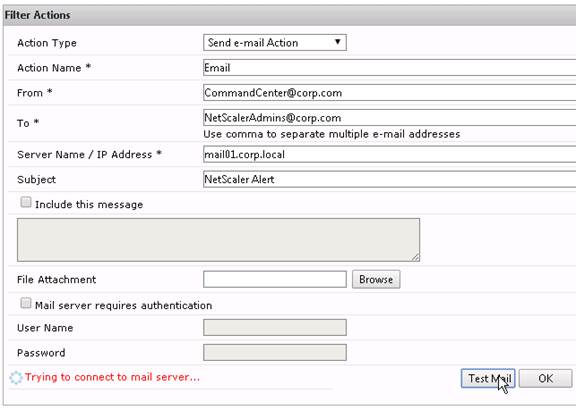
- Enter a name for the action.
- Enter the email information including From and To addresses and the mail server name. You can click Test Email. Click OK when done.
- Click OK when done adding actions.
- If you have scheduled maintenance, you can schedule the triggers to disable and re-enable. Select the trigger and then click Schedule a Filter. 💡
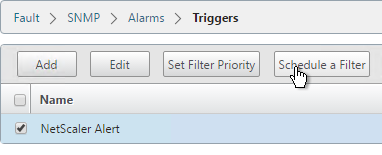
- Uncheck the Enable Filter box and set the time you want the trigger to be disabled.
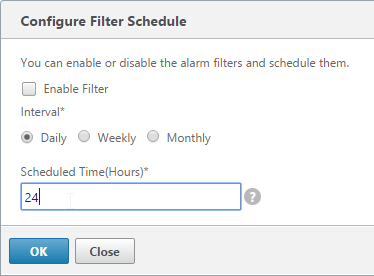
- Create another trigger schedule to re-enable the filter.
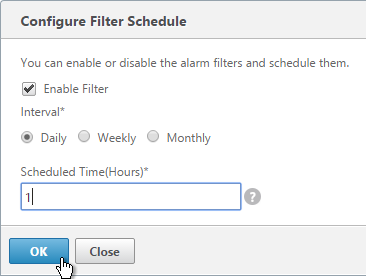
- Click the Scheduled Filters button to view the schedules. For more info see CTX211879 How Do I Suppress Command Center Alarm Related Actions For a Particular Time Period?
Use Command Center
See the release notes for new features in Command Center 5.2 build 46.7. 💡
See CTX211875 How Do I Monitor and Manage Changes on NetScaler Using Command Center? for an overview of Audit Templates and Audit Policies.
See docs.citrix.com for information on how to use Command Center to monitor and configure your appliances.
Hi,
I am trying to migrate from Citrix Command Center v5. 2.48.2 to MAS v12.1.x. But as soon as the process is initiated it is throwing an error java exception handshake sslv3. Please help me to rectify this issue. Thanks in advance
I wonder if you have to modify the ciphers on ADM so Command Center can connect to it. You can do a Wireshark, search for ssl.handshake, and compare the client’s and server’s SSL ciphers list.
Just an FYI for anyone who tries to add a v12 Netscaler to CC. The version of JScape on the Netscalers is newer than what is used in CC and will throw an error during discovery (Error while adding Trap Destination cause: java.util.NoSuchElementException: no common elements found). Citrix Support has a private hotfix available that fixes this issue.
Thank you Geoff! We had the same error once we upgraded to v12. Contacted Citrix Support for the private hotfix and we are back on track.
Hi Carl,
Can you please let me know the recommended version of Java for Command Center version 5.2.48.2. Currently, after the NS upgrade to 11.1.55.13 the Java process is utilizing almost 100% CPU when tried to pull any reports on Command Center
Thanks in advance
Venkatesh K
Have you considered migrating to NetScaler MAS since Command Center is no longer being developed?
I don’t have any Java version-specific guidance.
Planning the NMAS upgrade for next year
Hi Carl,
Can you please let me know how to disable the capture of AppFlow logs to the command center, because this is what is constituting for the high CPU utilization on the command center server. For some reason, we have disabled AppFlow on the NS and now the CPU utilization on the CC server is normal.
Thanks in advance
Venkatesh K
Command Center doesn’t do AppFlow, but it does do Syslog.
On NetScaler, go to System > Auditing > Syslog. On the right, go to the Servers tab and edit the server. Make sure AppFlow is not selected.
Is Administration > Database Management > Database Monitor Settings available for Release 5.2 Build: 46.7 Linux build?
I have upgraded to the latest build, but still cannot find that option.
Maybe it’s Windows only? It’s definitely in my Command Center 5.2 46.7.
Hi Carl,
For some reason I don’t have Database Management in my Command Center either. Can you think of any reason? I went as far as updating to the latest version 5.2 47.3 for Windows. I need to configure automatic purge of data but I am unable to without this tab.
Did you do internal database instead of Microsoft SQL?
Nope, I’m running it off of Microsoft SQL.
Hi Carl, wanted to ask whether you integrated Cloud Bridge with Command Center with CC management or SVM IP?
I have not done any Cloud Bridges. SVM, certainly.
Any ideas why I would not see any data under Reports Netscaler Gateway Dashboard? I have syslog setup and snmp configured. I can see syslogs being generated but nothing in the Netscaler GAteway section. Have another CC setup pointing to a different set of Netscalers with Gateway enabled and data shows up fine under this section.
Hello Carl, When setting up Command Center by default does it alert on all SNMP events or do you have to specify. Also will Command Center alert on GSLB events such as service down or fail-over?
Thanks
When you create the trigger you specify the SNMP events you want to be alerted for. I normally do Major and Critical events. You can also add a trigger for EntityUp so you know when entities come back up.
To configure the SNMP Alert priority, on each NetScaler, go to System > SNMP > Alerts.
Syslog and logfiles growing like crazy, 5 million syslogs after 2 weeks.
Tabels in SQL dbo.ccsyslog and dbo.sslvpn are the main culprits. How to configure this correctly. Thanks for all your knowledge Carl!
Commandcenter 5.2 45.4
Make sure TCP Logging is not enabled on the NetScaler.
I usually don’t use Command Center for Syslog and instead I send it to a real Syslog server. Note, NetScaler Management and Analytics System was announced at Synergy this week and it’s supposed to do a better job of receiving logs: definitely performance logs, not sure about syslogs.
Hello Carl,
I am new to Command Center so just wanted to ask what’s the major difference between NetScaler Insight Center and Citrix Command center?
I get command center manages more appliances as Insight Center is specifically for NetScalers OR there are any other extra features. Plus do we need both or just command center is enough?
Regards,
Madhu
Insight Center collects AppFlow records.
Command Center uses SNMP and Syslog. NetScaler sends SNMP traps to Command Center. Command Center uses SNMP to poll devices. NetScaler can optionally send Syslog to Command Center.
In other words, they are completely different. Citrix has a new product called NetScaler Management and Analysis System, which merges Insight Center and Command Center.
hi carl , first of all your site is very useful, keep it pls. I have a problem that I want to get mail when a url match my start url profile. How can I do this ?thanks so much
Hi Carl, Thanks for the very detailed document… We recently installed CCC 5.4.45.2 and configured all devices. We have couple of MPX boxes with NS Gateway configured and few VPX with NS Gateway.
We see all devices listed under Citrix NetScaler >Device Inventory However, when we go to Citrix NetScaler >Device DashBoard there is only one VPX NS Gateway is listed. We are not sure why the rest of the devices are not listing.. Could you help us here.
Did discovery complete successfully?
Or maybe the other devices have not sent any SNMP traps to Command Center yet? Or firewall is blocking SNMP traps?
I have taken this activity from Shinz and i still see the same issue. The device discovery is successful but we only see one VPX listed there. Citrix has informed us that the private key size could be the issue here. I even tried with the higher bit rate of private key size but still the issue persists. Any help
Hate to bring up an old topic, but the Google has failed me.
I’ve tried both the 5.2.45.2 and the 5.2.44.11 installer, and neither give me the option to add SQL settings. It goes straight from Install Type (I’ve tried all 3 options) to Security Settings. Skips right past the SQL settings.
For giggles, I tried to install the 5.1.36.7 version and SQL options popped up for me.
Is there a secret to getting this option to pop up in the 5.2 install? Or, is there a way to configure afterwards (I’ve yet to find that option as well)? Thanks!
Are you running the full install and not the upgrade pack? Also see http://support.citrix.com/article/CTX129263
I was definitely running the full install pack. I used the article supplied, but the install seemed botched from the start.
I ended up back-tracking and trying different install versions. Eventually, 5.2.43.19 gave me the SQL options. I then upgraded to 5.2.45.2.
I ended up not being able to use 5.1.36.7, as it didn’t support SQL 2012 R2.
Thanks for your insight, sir!
Carl, First awesome documentation. Keep up the great work that you do! I am having an issue that is driving me crazy. Hope someone can help. I can’t get the web page to display. After investigating did noticed in the wrapper.log I get the following error message: Inside generateKEK, key fragment files do not exist. I have created three brand new servers and did an complete new install using the evaluation option but the same error keeps showing up in the log. Can anyone help? I am out of ideas. Thanks in advance.
Hi Agalarza,
Did you install NCC in centos 6.6 ?
I have the same issue, anyone can solve this?
check with netstat -a if the host is listening to 443 or 8443
After enabling AD authentication, all users in the domain have read access to Command Center. When any user attempts to log in to the Command Center console, they are added to the default “Users” group which grants them read permission. This group can’t be deleted and I can’t create any other group with less than read permission. Has anyone else run into this or found a way to restrict access further than read?
You should be able to configure an LDAP search filter.
Can you please help a little more with this. I have tried memberOf=CN=group,OU=1,OU=2,OU=3,DC=corp,DC=ts,DC=com in the LDAP “search filter” but no luck. Doesn’t let anyone log in from the domain.
Thanks
Direct members? Or nested groups?
nested group
For nested, you’ll need the special code. See https://www.carlstalhood.com/netscaler-gateway-12-ldap-authentication/#action and scroll down to the Search Filter.
For those using categories (and probably also failure objects) in the alerts for specific loadbalancers (as I am doing). You will not get your objects listed until you got the object once failed through the netscaler. I had to disable my LB once to get the LB as failure object listed in the CCC.
HI, is it possible to generate a email alarm only if the VIP or Server or Service is down more than 30sec by example. So if the device comes UP after 20 sec will not send email ?
Thanks
Hi Carl,
thank you for the walkthrough i am a big admirer of your blog on all things. I am trying to get a bandwidth utilization report on the netscaler as well as set alarms when it hits a certain threshold however i dont seem to find which alarms one has to set, the reason i am doing it is so that i can see whether i need to upgrade my license.
Also the walkthrough above mentions when adding the first netscaler not to hit Done but hit the Advanced settings which on Citrix Command Center v 5.2 44.11 doesn’t seem to have that option so i went through that on the administration tab instead.
My question to you is if you know the answer, is what should i be looking at to monitor the bandwidth utilization to give me an idea whether i should upgrade to 1000 or 3000 license? And second which i think it will be easy for you to answer is once you add the netscaler shouldnt the netscaler appear on the dashboard under Monitoring/Dashboard, i can only see the virtual servers, services and servers if i click on the Dashboard the VPX doesn’t show.
Thanks
Carlos
The appliance should be listed under the Citrix Network tab.
For licensed throughput, I think you can do a Quick Report on Interface > Rx Average bandwidth. There’s also IP > Megabits Received. The license is based on received bandwidth.
I’ll try to fix the documentation when time permits.
Hi Carlos,
I just did a fresh install of 5.2.44.11 and in the Welcome wizard there is indeed an Advanced Settings section. The wizard asked to change the root password. Then I add a device. After discovery is complete I click Continue. But before clicking Done, new items appear on the right side of the screen.
It’s easy to miss and if you do miss it you can certainly use the Administration tab to configure the same settings.
Thanks Carl, weird I didn’t see it. Even when I tried to add another netscaler. I will try again. Although as you said I did do the rest of the steps you have using the administration tab.
Do you get the netscaler appear under Citrix Network, Dashboard because for some reason I don’t get mine come up. I get all the virtual servers and services but nothing on the dashboard. I even logged a ticket with Citrix and they haven’t been able to figure that out.
Thank you again.
The Advanced Settings only appears during the Welcome wizard. If you’re adding a device after that then that menu won’t appear.
When I go to Citrix Network > Device Inventory > NetScaler – my device is listed. The Home tab shows a number of devices and if I click it then it goes to Citrix Network tab.
When you setup Command Center, did you specify a SQL account that is db_owner in the database?
Thanks Carl. Ok that makes sense, maybe I missed the welcome screen. With regards to the home button I see my one netscaler there when I click on that it does take me to the Citrix tab but then I don’t have the netscaler on the dashboard. I did specify the account ctxsvc as per your steps above and it is a Sq owner.I might just strip this server and start fresh again and see if that takes me there.
When I try to install Command Center, I get to the database settings step, and I get the error ‘Unable to connect to the database’.
Any ideas on what this problem may be? I can connect via ODBC, and I can telnet to the server on port 1433.
When you connect via ODBC, are you able to enumerate the databases? Are you using a SQL account and not a Windows account? Any login failures in the SQL event log?
Chk if rdp option is enabled in server where sql installed.